Social media analytics: how to measure success

It’s not enough to just have a presence on social media. You need to be producing content that inspires, informs, engages and converts people to your cause. But how can you tell whether your posts are successful or not?
We’ve written about the importance of proving the value of social media to the rest of your team and now it’s time to dive deeper into social media analytics and how they can help you boost your social media output – and skills.
Social media analytics can be scary, especially if you haven’t looked at all these numbers before and what they mean. However, you don’t need to be a data analyst to present the results of your work to the rest of your team.
This post will explain what all the different social media stats mean and which ones you need to look at when measuring the success of your social presence.
The stats you need to focus on will be dependant on:
- the objectives that you’re setting
- the frequency that you look at them
Different analytics for different objectives
The objectives that you set for your social media presence will guide you in choosing the most relevant metrics.
Awareness
If you want to use social media to increase the awareness of your organisation, then you need to focus on the metrics that have to do with:
- number of views (impressions)
- reach
- traffic to your website.
These metrics will help you to understand how many people viewed your content, how many new followers you may have gained and the number of people who wanted to learn more about your cause by visiting your website.
If your primary goal on social media is awareness, then you need to focus on these metrics:
- Follower growth: the number of followers that you’re gaining, is the fastest way to tell if your social media presence is improving. However, it shouldn’t be your ultimate goal to simply increase your followers, as the total number may consist of irrelevant followers – or spam/bot accounts -who might harm your engagement. Also, it’s better to have a smaller following who engage with your content than lots of followers who barely engage at all.
- Reach: the reach of your posts will help you to understand the actual number of people who see your content. Your reach does not always depend on your number of followers as it can be even higher if you’ve managed to gain lots of shares. Thus, looking at reach metrics will help you find your best performing posts.
- Impressions: the number of impressions has to do with the number of times that your content is displayed. For example, if you’ve had 70 impressions in your post, you wouldn’t necessarily reach 70 people since some of them may have seen your post twice if they use social media more often.
- Visits to your site: this is simply the number of clicks to your website that came through social media. If you’re running a campaign, you can use this metric to analyse your best-performing posts, your best-performing channels and even the types of content that drove the most clicks. For example, do posts with images lead to more clicks? Or do you need to try different messaging (for example, a specific call to action) to increase the number of clicks to your site?
Engagement
Engagement is the most important metric when it comes to measuring the success of social media because it tells you how many people took an action (liked, Retweeted, commented, shared) and were engaged with your post.
Social media engagement can help you build a loyal base of supporters by keeping them interested in your charity and the work that you do. Having engaged followers can also help keep your social presence active when you’re not running a specific campaign.
The most important metrics that have to do with engagement are:
- Likes: the number of likes on a post is the easiest way to measure the engagement of your social presence. It’s also the easiest way for your supporters to show they like your content.
- Shares: the number of shares indicates the relevance of your content to your supporters. If they like your content enough to share it, then it means that they found it appealing, relevant and interesting enough to share it with their network of family and friends. It’s a very strong indication of your social media success.
- Comments: the number of replies or conversation your posts is inspiring. People who spend time leaving a comment are usually more engaged with your page compared to those who simply like your post. Facebook, for example, strongly encourages Pages to post engaging content so always think about how your post could get engagement. Maybe try asking a question or publishing an interesting article or video that will make it easier to start a conversation through the comments.
Conversion
Conversion metrics can be different for every organisation but when it comes to charities, it’s usually in relation to fundraising.
If social media is part of your fundraising strategy, you need to measure the success of your posts to see whether they’re driving people to make a donation or to sign up to a fundraising challenge. It’s not enough to measure the awareness and engagement in this case as success means conversions.
The most common metrics related to conversion are:
- total number of donations: you need to find out the total donations that came through social media or even the number of people who found out about your campaign by seeing a post on social media by setting up a Goal in Google Analytics
- conversion rate: the conversion rate is determined by analysing the number of people who saw a post and those who actually who ended up donating to your cause
- the number of new donors: another useful metric which has to do with the number of new donors that you’ve found through social media and how this number may compare with your recurring donors.
You can analyse these metrics through Google Analytics, tracking links or through a CRM database.
(We’ll be able to help you even more with these over the next few months so stay tuned!)
How often should I measure my social media performance?
It’s up to you to decide on the frequency that you’ll be measuring your social media performance.
However, it’s common for many of us who use social media to follow this process:
- Check your social media performance weekly. Have a quick look at the change in your number of followers, the reach of your posts, the number of clicks and the engagement you’ve had.
- Compile a monthly social media report to compare the success of your work with the previous month. This report could be a spreadsheet, which includes the metrics that are most relevant for your work and your organisation or it could be an overview of everything that we’ve mentioned above or even a narrower focus on a specific objective. It doesn’t need to be a spreadsheet either – it could be slides or even a Word doc – whatever is easiest to read (and understand) for those who need to see your stats.
Lightful analytics: understanding the graphs
If you use the Lightful Platform, then you’ll have noticed that we’re trying to make Analytics as visual (and helpful) as possible – so that analytics doesn’t seem so scary!
There are lots of graphs and not all of them might be relevant to you, however, we want to help you understand what these graphs mean and how you can use them from now on to improve your social media success.
You can use Lightful Analytics as part of your quick weekly overview or even in the analysis of your monthly performance.
A weekly digest of your social media activity
If you want to have a quick look at your social media analytics every week, you can check out our Weekly Digest to find out the overall success of your posts in the past week. This is an overview of your social media activity and it can help you to improve your upcoming content and set KPIs.
A closer look at your social media analytics
If you want to spend more time delving into your analytics, then the Weekly Digest by Social Channel overview dives deeper into the success of your social posts on each social profile. The Weekly Digest focuses on your overall social media performance, whilst this one can help you to analyse your performance on each social network.
It is still a quick way to track the most popular metrics for all your social profiles by scanning them horizontally.
This graph can help you find:
- your best performing channel
- your biggest growth of followers
- your posting frequency
- the engagement you’ve had on all your social profiles
- the number of clicks you’re gaining from each social profile
Thus, you should be able to understand how you’re using each channel before focusing on each individual post and the performance it had.
If you want to find out more about your best performing posts, you can click on your Published posts to analyse their success based on the likes, comments, shares, and clicks they’ve had. You can even filter them to find the posts with the biggest success on likes, shares or clicks.
Measuring your social media engagement
If your main objective is to improve engagement with your supporters, then the graphs below should be really helpful. You can see an overall overview of your engagement across all your social profiles or you can focus on a specific social network.
Measuring the growth of your followers
If you’re focusing on improving awareness of your organisation through social media then you should start tracking the change in the number of followers.
You can find the best-performing channels, in terms of increasing followers, and you can improve your success by focusing on the channels that are most effective.
For example, if you were mainly using Facebook up to now but you see a big increase in followers on Twitter, then it might be time to start investing more time in your Twitter content.
Analysing the number of clicks you had from your social posts
Another good way to measure Awareness as your objective is to analyse the number of clicks you’ve had from your social media posts.
Sometimes it’s not enough to measure your follower growth if they’re not visiting your website to learn more about you, to get information or support or even to make a donation. That’s why you also want to track the number of clicks you’re having from all your social profiles.
You may be surprised by the increase of clicks from one channel, so it’s certainly an important section to keep an eye on. For example, if you’re running a campaign you can use the graphs below to understand your best-performing channels for awareness but also possible conversions.
If you’ve made it up to this point of the post, congratulations! You’ll be a social media analytics guru in no time! Invest some time in understanding your metrics and you’ll soon see a difference in your performance.
Did you know: you can now print and download your Analytics report through our Platform to make it even easier to share them with the rest of your team?
Accessing your Insights Report through Lightful
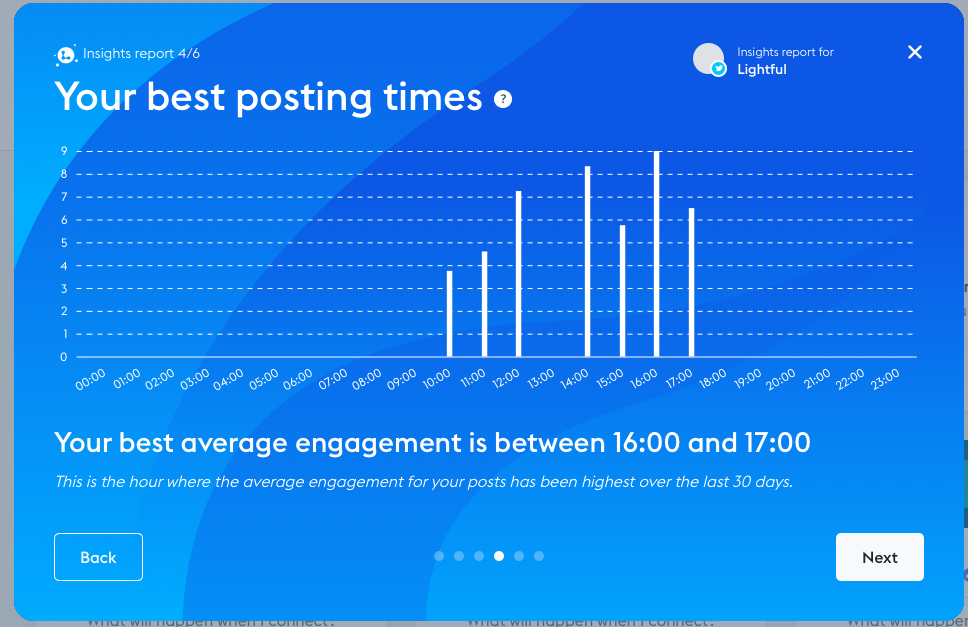
Find out more about your best time to post, your key metrics (engagement, growth, clicks) and the types of posts that work best for your organisation.
You can read out more here or start using them through Lightful’s platform today.
Looking for a better way to manage your social networks? Try the Lightful Platform to plan, schedule and measure all your social media posts in one place!
Latest articles

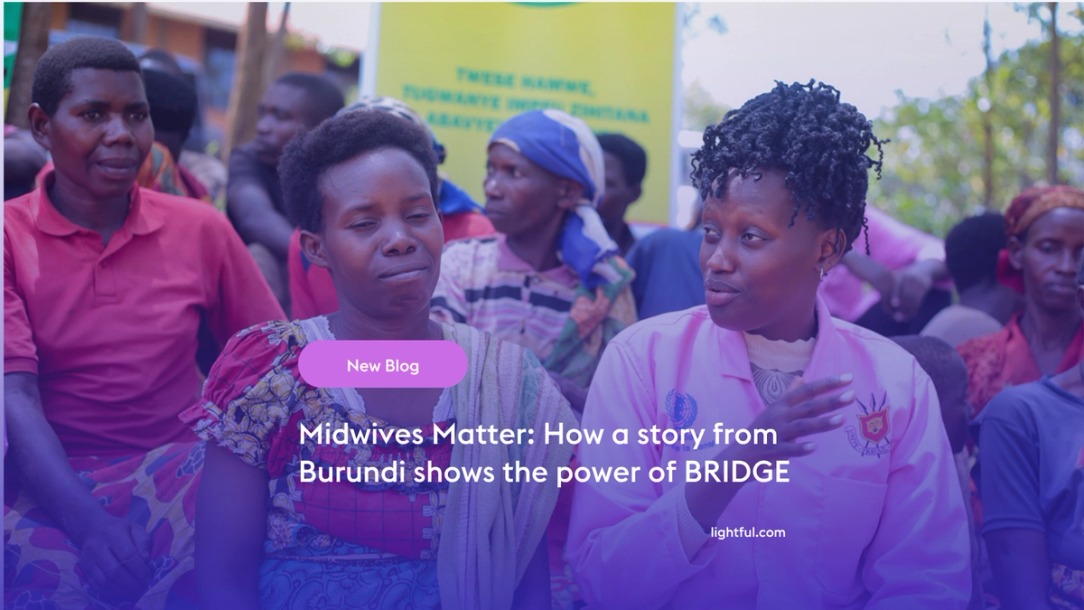
Over the past year, Lightful and the International Confederation of Midwives (ICM) have supported Midwives Associations across Africa, South Asia and the Eastern Mediterranean to build their digital confidence through our BRIDGE programme. These organisations were starting from very different places, but all shared the same goal: to use digital tools to strengthen their voice, raise their visibility and advocate for better outcomes for women and babies.
Related posts
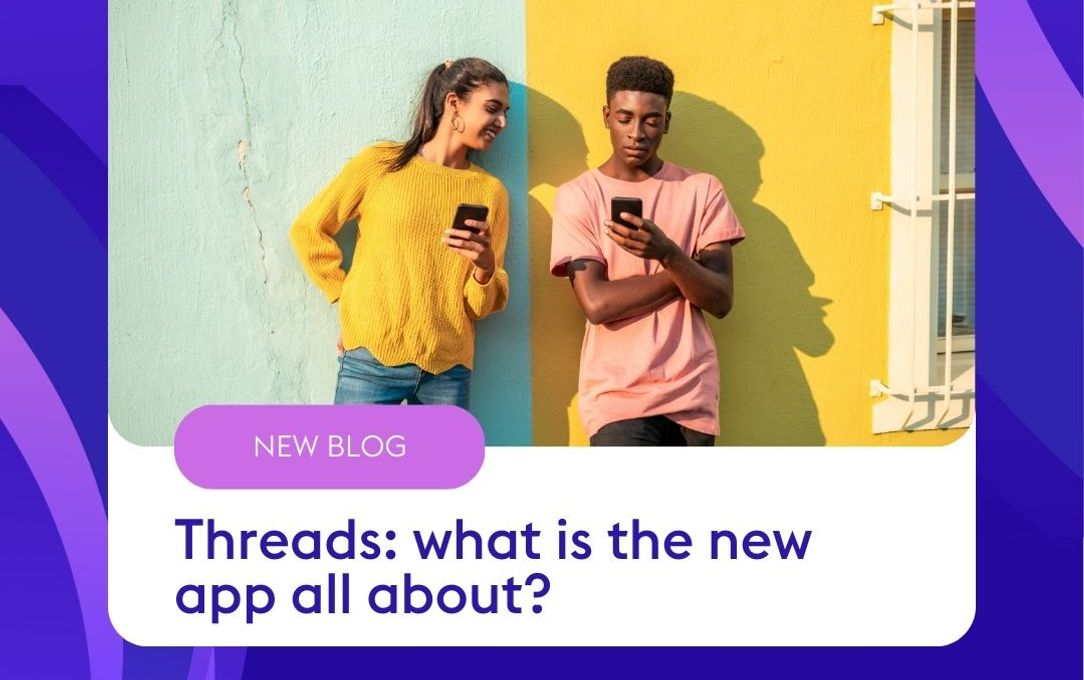
Meta’s latest app gained over 100 million users in just a few days, becoming one of the fastest growing apps ever. To put this into perspective, it took two months for Open AI’s ChatGPT to reach 100 million users, and we thought that was fast!
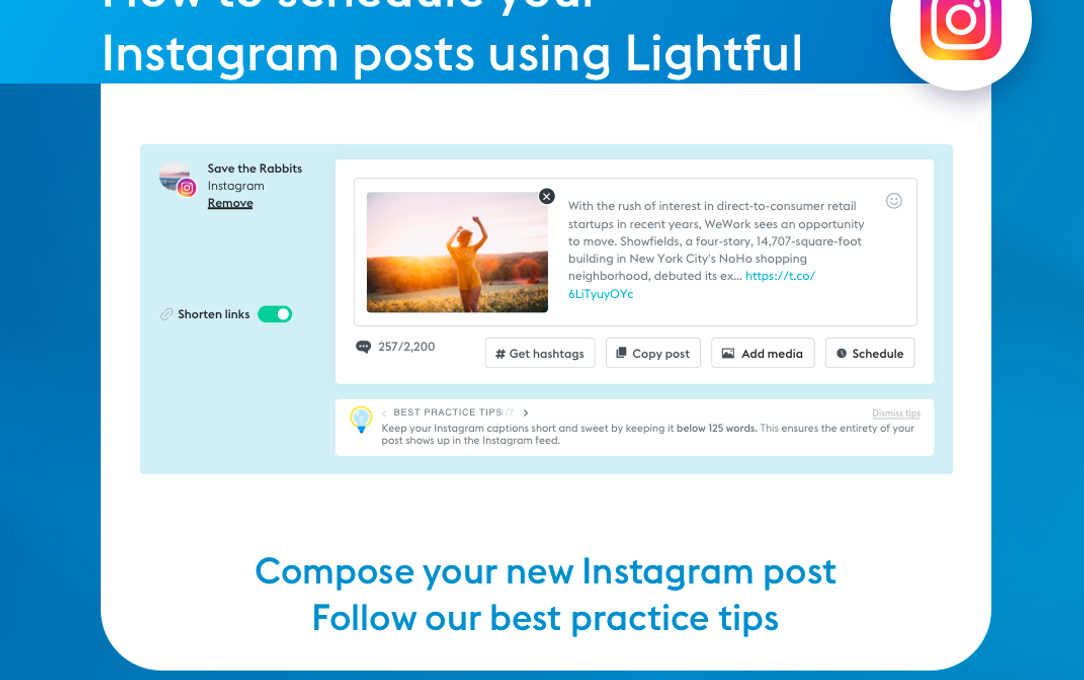
Instagram is a visual channel that helps you build an engaged community of people who are following your cause.
See who we help


Contact us
Want to learn more?
Email Jonathan and start a conversation